Wifi Tracking means knowing your customers’ habits.
There is so much you can do with wifi tracking data besides just counting customers. Read the data, interpret the data, react to the data.
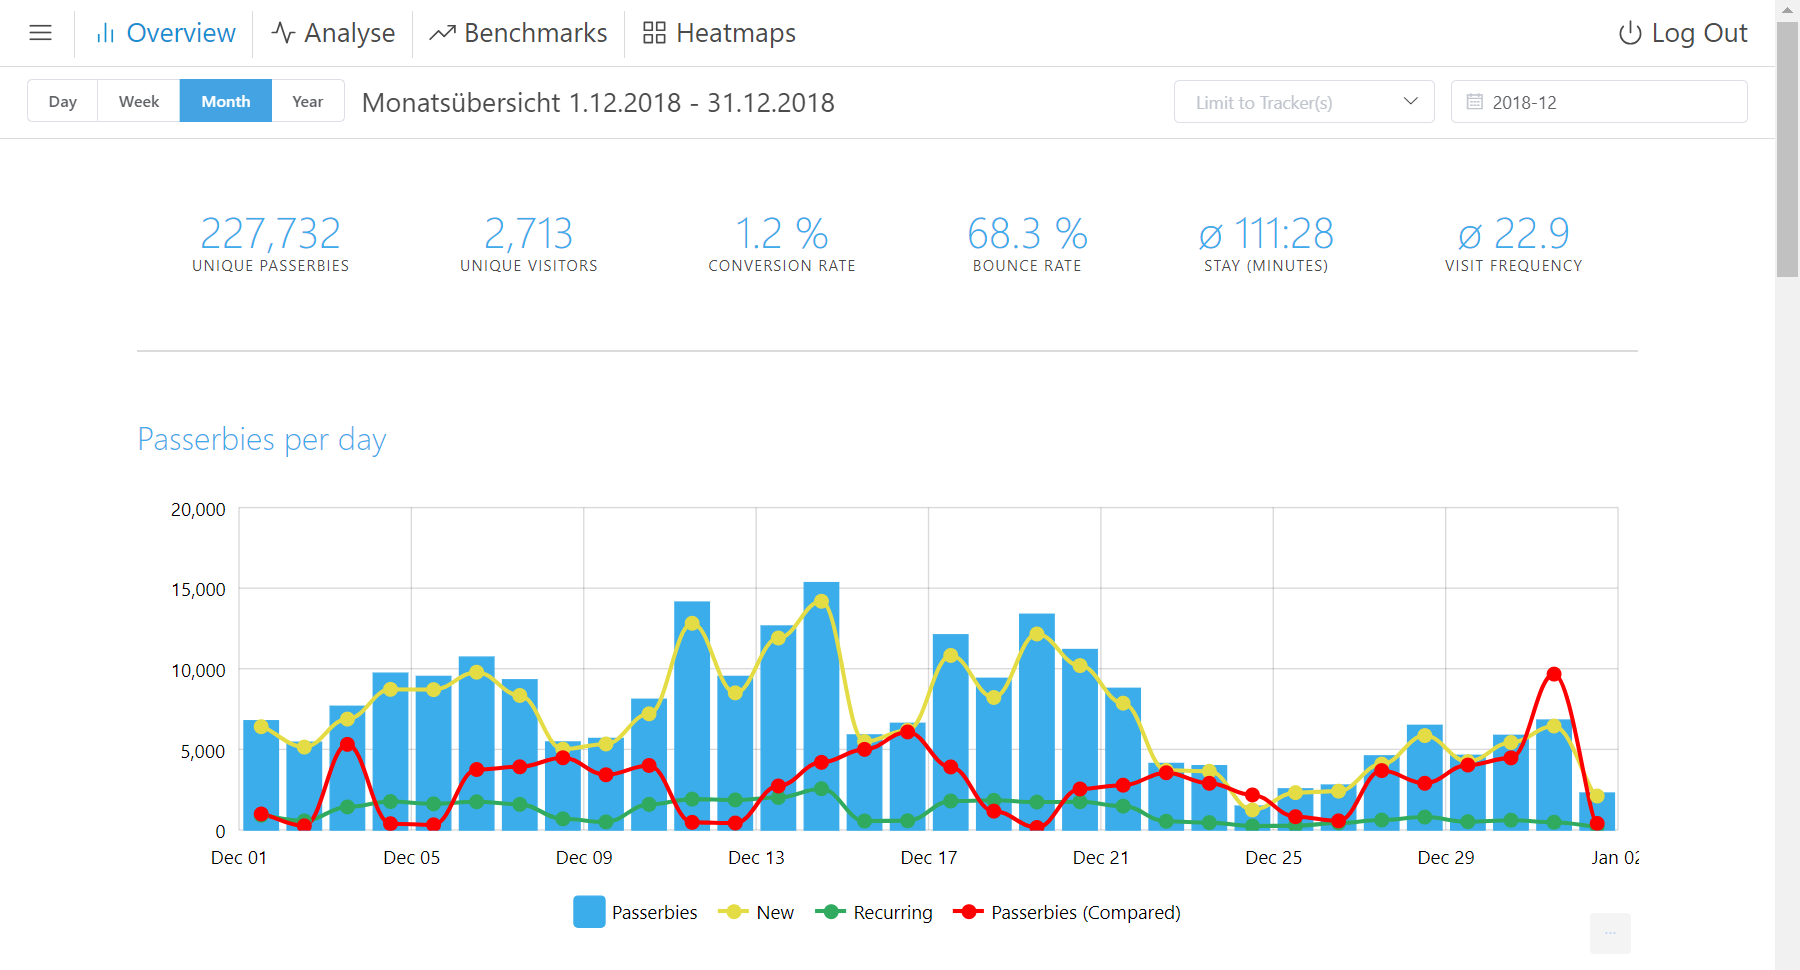
Take a deeper look.
See how many passerbies convert into store visitors. Learn about average visit duration and number of visits per visitor.
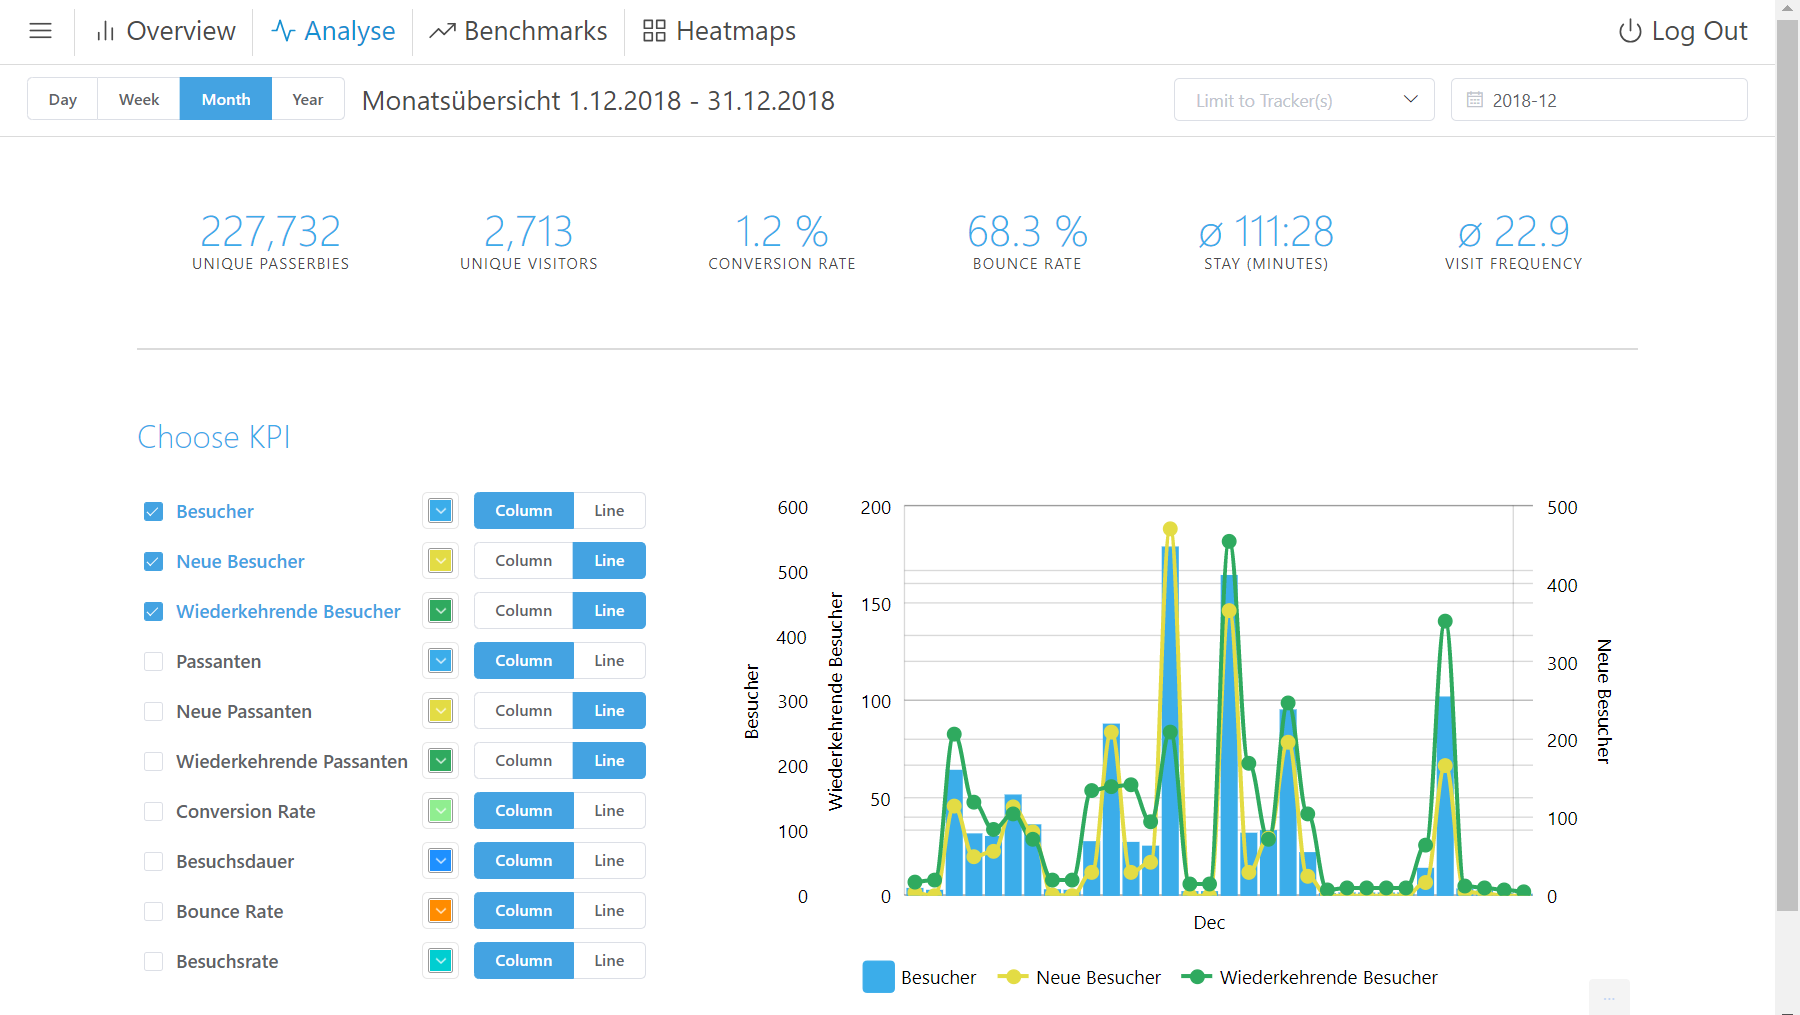
Analysis
Create stunning graphical interpretations of your tracking data. Select all the key performance info you need, make it lines or bars, set a timeframe and your are done. Export to graphics, PDF or even Excel.
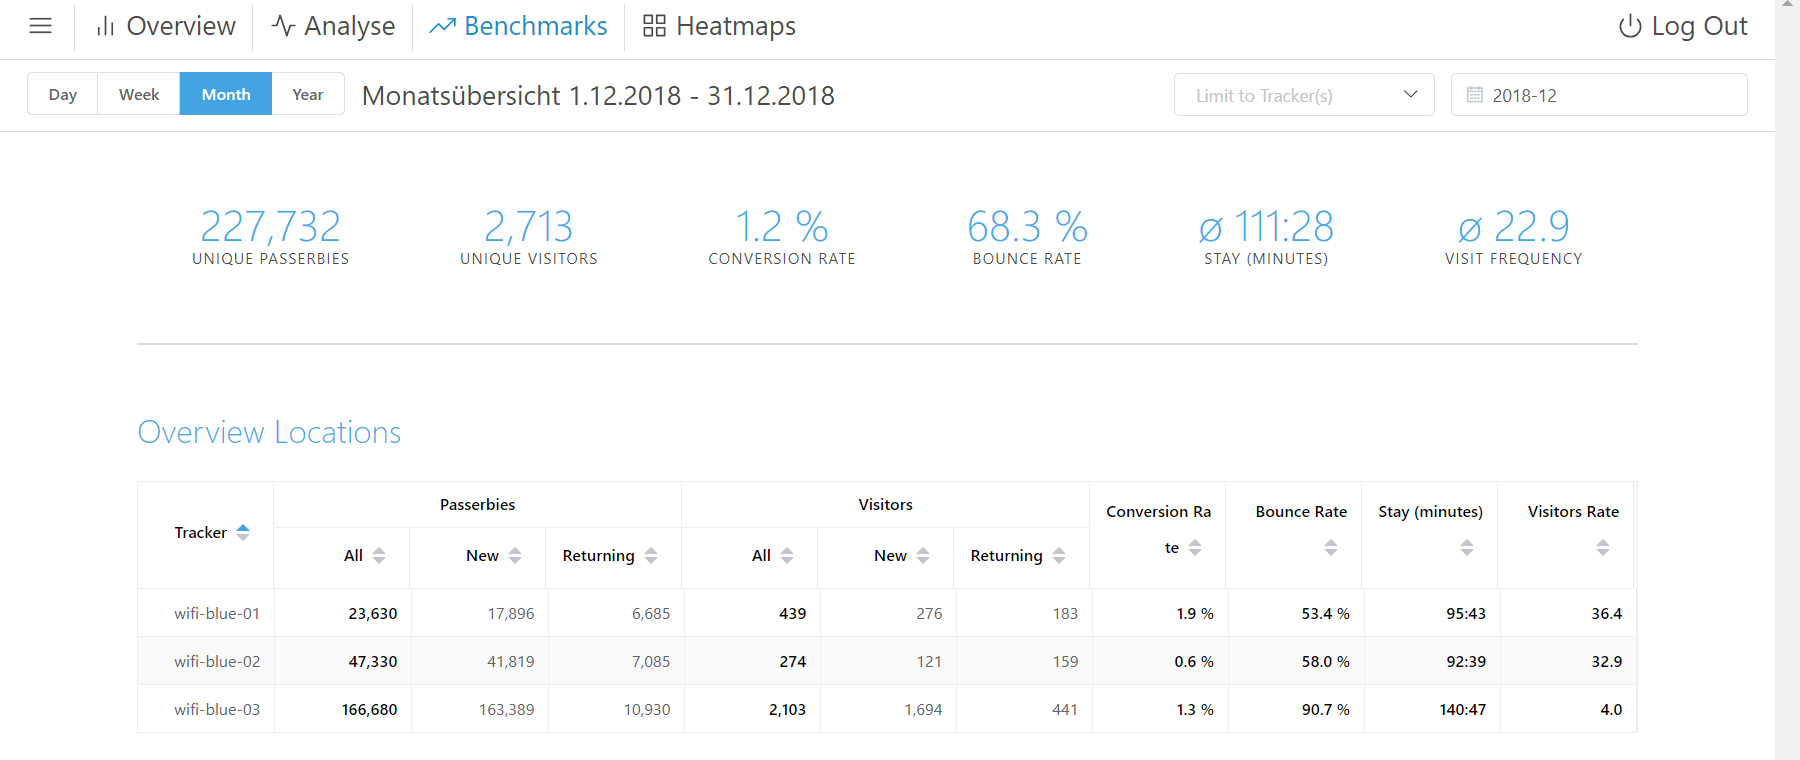
Benchmarks
Sometimes it is best to see everything in an organized, trusty table view. Display all performance measures for every one of your trackers in our handy benchmark view.
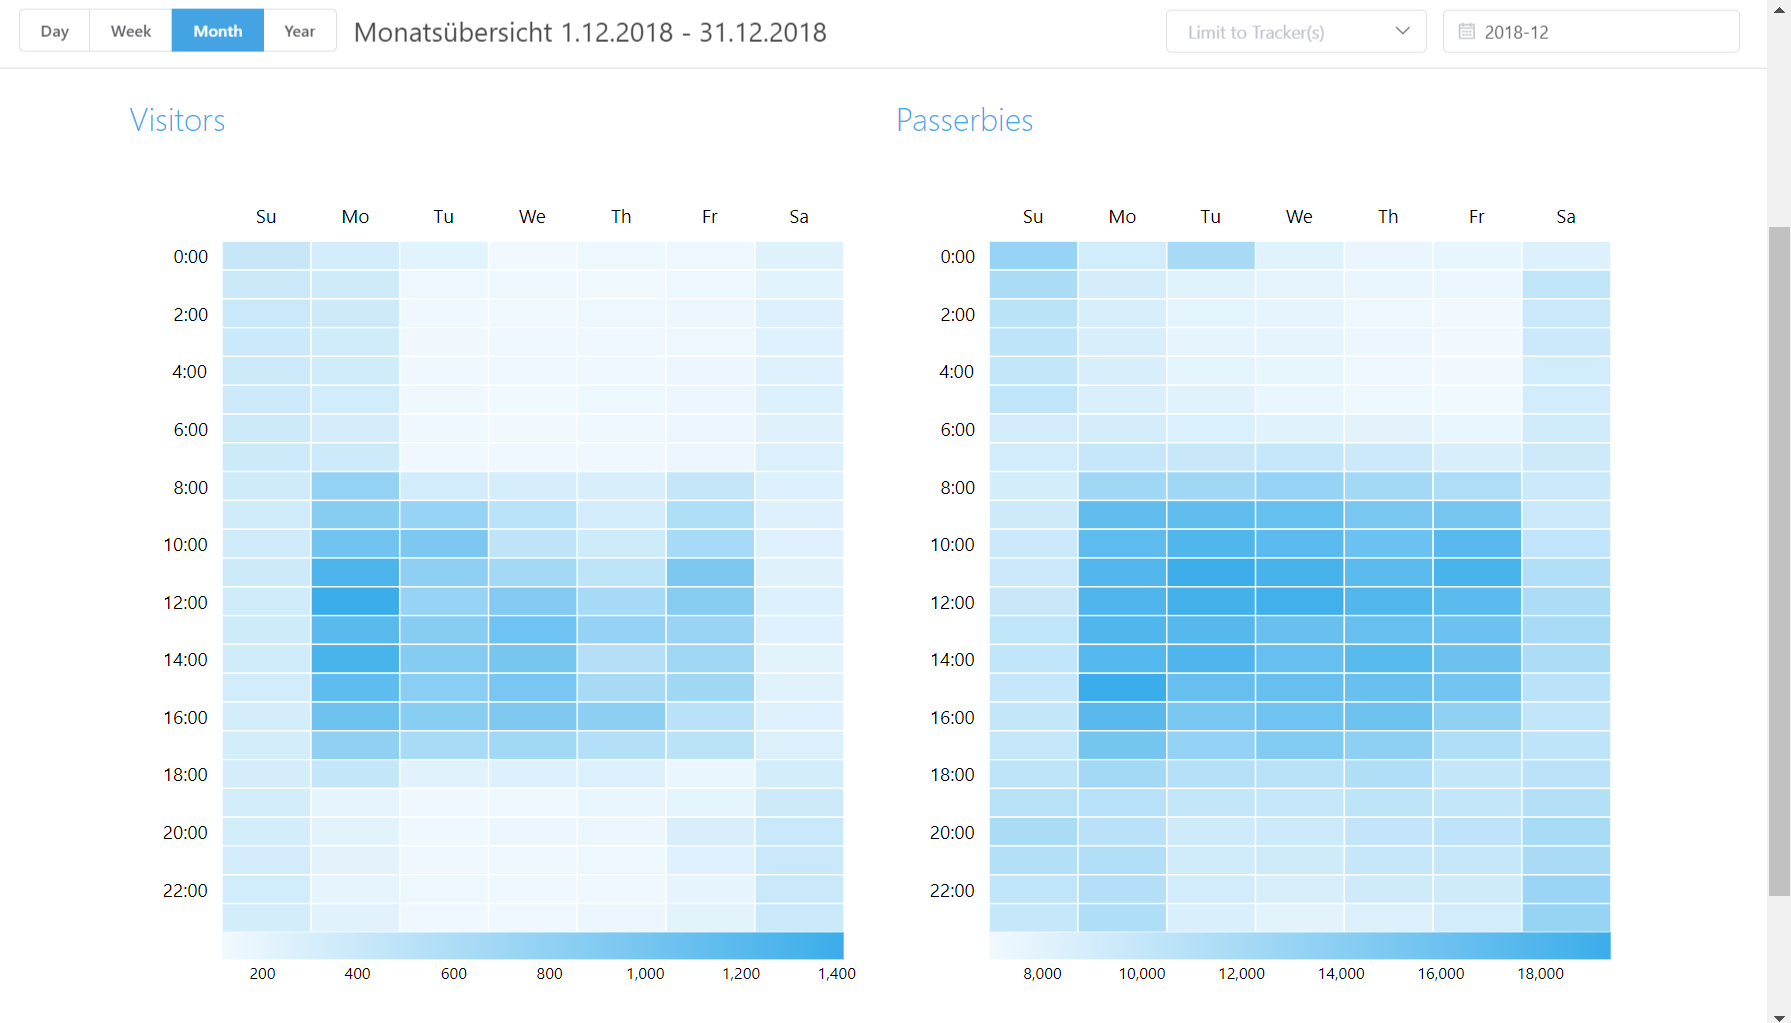
Heatmaps
When are the rush hours in your store? Does it make sense to expand opening hours on saturdays? How many potential visitors just pass by without entering? See this and more in the heatmap view.
Heat up your visitor count
Most store owners are clueless about how many visitors there really are inside their stores at any given time. See the light with our Heatmap View. It gives you detailed visitor and passerby counts for any desired timeframe. Compare days, weeks, months and years. Use more than one Wifi Tracker in larger stores to see where visitors acummulate.
Comprehensive Analysis gives you clarity
Numbers are boring. Unless you transform them into something that immediately catches the eye. Build your own tracking data interpretation graphs. Select the data you need, how it should look and you are done. Export as JPG, PNG oder PDF for further use and save yourself a lot of time while building reports.
Keep control of your customer visit flow in all of your stores.
Build a network of Wifi Trackers to overview all of your stores. See live and historical views of what is going on at our locations without leaving the desk. All combined in one sleek, easy-to-use interface.